Pre-1948 Planning Report: Children’s Playgrounds in Boston
This post was guided by Cities, Space, Place & Time, a graduate course at Tufts University. The goal of this assignment was to gain a historical and spatial understanding of the 1948 study, Children’s Playgrounds in Boston: An Evaluation of Space and Location and to understand the evolution of Open Space through time and space.
Introduction
The primary objective of Childrens’ Playgrounds in Boston: An Evaluation of Space and Location was to evaluate playgrounds as a system. This 1948 study was considered the first step in the preparation of a comprehensive master plan. It comprised one phase of the recreational plan that determined adequacy and deficiencies in the playground systems through the analysis of safety standards, size, and accessibility by City Planning Board. Additionally, the plan made recommendations for space and location that could provide sufficient playgrounds for “unserved” children.
Root Causes
1. Migration
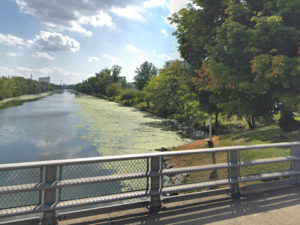
With every decade starting from the late 19th century rapid industrialization era, population growth in the Cities rapidly grew and providing for children’s needs became challenging. As increasingly high proportions of Americans began to live in the city, the demand for adequate and socially necessary development of children became apparent. (p. 5)1 Figure 1 shows a bird eye view of City of Boston in 1877, highlighting the Industrial Revolution, prominent green spaces, and city growth. Figure 2 shows view of South Boston with lack of efficient playgrounds for children. The Peninsula District had more than 10,000 children and only two playgrounds that were larger than ¾ acres. (p.13)2

Figure 1 Birds Eye View of City of Boston, highlighting the Industrial Revolution, prominent green spaces, and city growth / Norman B. Leventhal Map & Education Center at the Boston Public Library

Figure 2 View of South Boston with lack of efficient playgrounds for children (only two playgrounds that were larger than 3.4 acres) / City Planning Board
2. Space and Location
It is observed that although the total area of playgrounds in overall Boston could theoretically provide the standard of minimum space for children, the size and distribution of these spaces was not strategically planned and didn’t account factors such as population density. These spaces were either not large enough, 35% of the total playgrounds didn’t meet minimum standards set in this study, or were inaccessible because they were surrounded by non-residential uses. (p. 7 and p. 29)3
Serving the Interest of Children
This study observes that the existing playground were neither planned or developed as a system. In the 1937 guide, Massachusetts: A Guide to Its Places and People, it was noted that despite Boston having a large park system, thousands of children continued to play on sidewalks. (p.6)4. This study evaluated playgrounds as a system to determine their adequacy, adopting measurable standards that determined if Boston children were “served” or “unserved.” “Served” was used as a term for Boston children that had access to sufficient public playgrounds and “unserved” was used as a term for Boston children that didn’t have access to sufficient public playgrounds.
The study uses National Recreation Associations definition of children’s playground as providing opportunities for children within the ages of five and fifteen and limits the scope if its study to public playgrounds. (p.12)5 Referring to the NRA, the study categorizes the term “juniors” for children 6-11 years in age and “seniors” for children 12 to 15 years in age, recognizing play needs of different age groups. To determine the sufficiency of playgrounds for children, the study considered factors such as size and location of existing playgrounds by creating a minimum standard: 100 square feet for “juniors” and 375 square feet for “seniors” and addressing maximum allowable walking distance (between ¼ mile to ½ mile radius) with consideration of barriers such as traffic and topography. (p.15)6 These factors were studied by districts that are today known as neighborhoods of Boston.7

Table 1 Child Population Density by Districts / City Planning Board
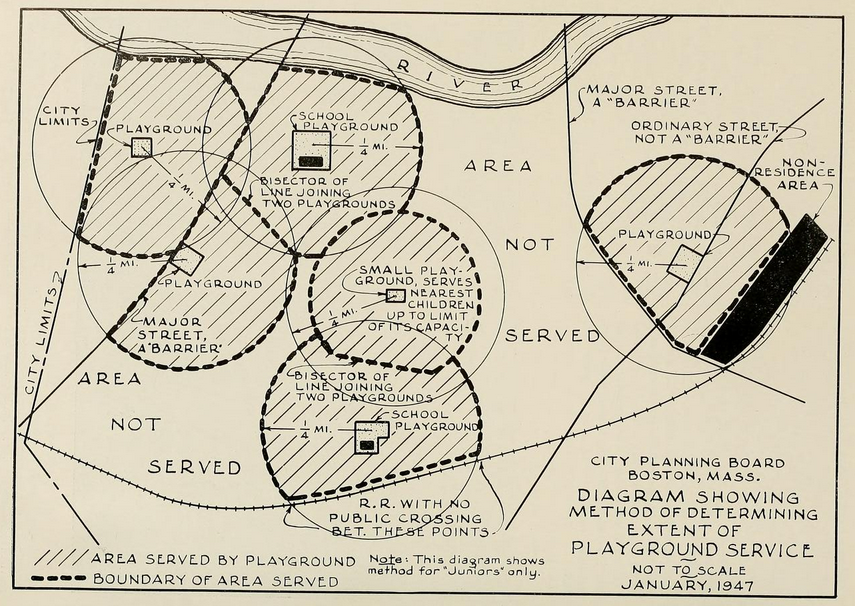
Figure 3 Extent of Playground Services for “Juniors” / City Planning Board
Proposed Reforms or Policies
The City of Planning Board proposed that the attempt to build playgrounds as a system under the legislative act (chapter 412 acts of 1898) be revived by possibly authorizing the city to borrow money and expand the playground system. (p. 8 and p. 38)8 It was also recommended that new legislation provide proceeds from sales of recreation to be used for new recreation and that the City Planning Board review and study any sale of municipally owned lands before committing to a purchase and report them to the Mayor. (p. 8)9
Short and Long-Term Consequences
The short-term consequence of analyzing space and location was to provide effective use of funds that could be strategically concentrated on playgrounds and spaces that were determined as part of the system. (p. 7)10 The system was intended to provide sufficient use in terms of both acreage and accessibility to children.
The long-term consequence of this study was expected to redistribute playgrounds based on needs of children and gradually unite recreation facilities such as playgrounds to provide a balanced ratio of play and place. (p. 7)11
Demographic and Economic Context
The study does a great job at analyzing the need of different age groups amongst children but fails to address demographic and economic conditions such as race, public health, income etc. when observing children that are being “unserved.” This layer of analysis could have further provided information for who was being “unserved”. A demographic and income analysis could have helped mitigate outside influences that could have prevented playgrounds from being implemented in denser, lower income neighborhoods with underserved minority groups which are often at greater risk of environmental burdens. The study intends to create a balanced distribution of playgrounds instead of analyzing distribution of equitable playground spaces.
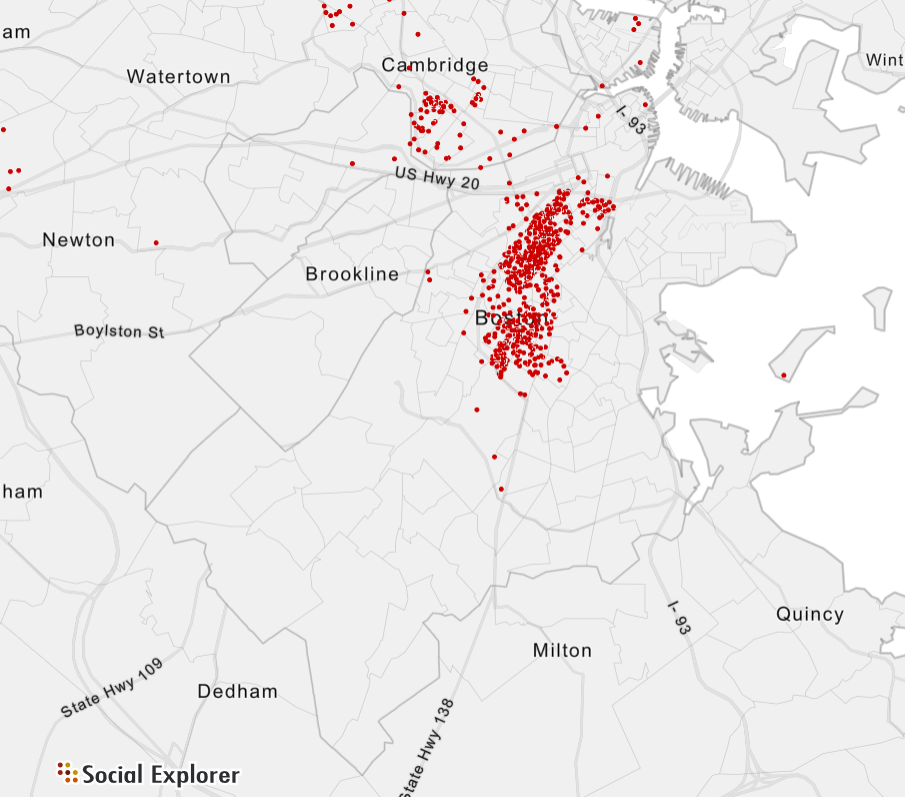
Figure 4 Total Population of African Americans in 1950 by Census 1950 Tract. *One dot represents value of 50 / Aqsa Butt, Social Explorer
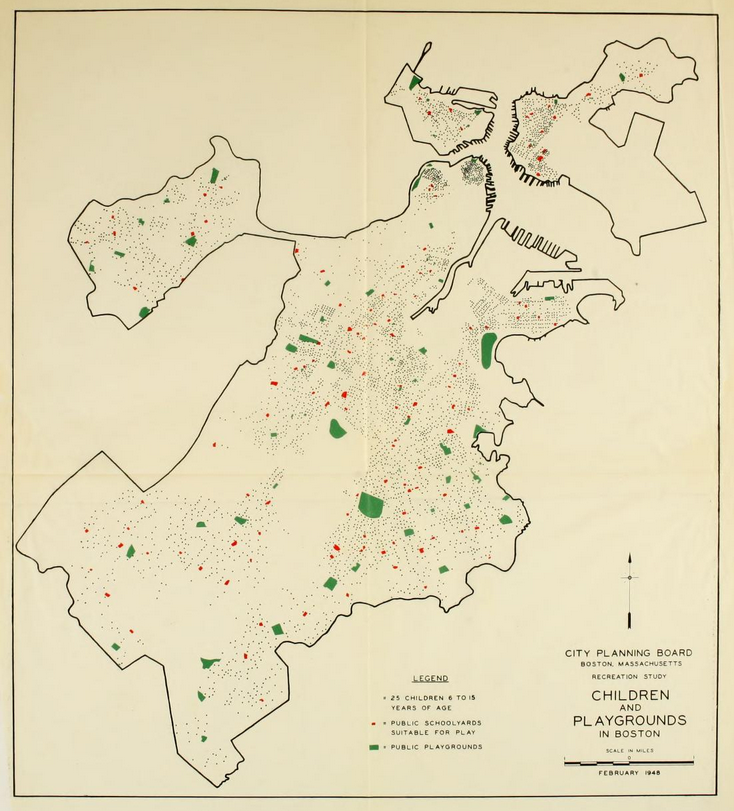
Figure 5 Children and Playgrounds in Boston.*red represents public school yards, green represents public playgrounds, and black dots represent 25 children 6 to 15 years of age / City Planning Board
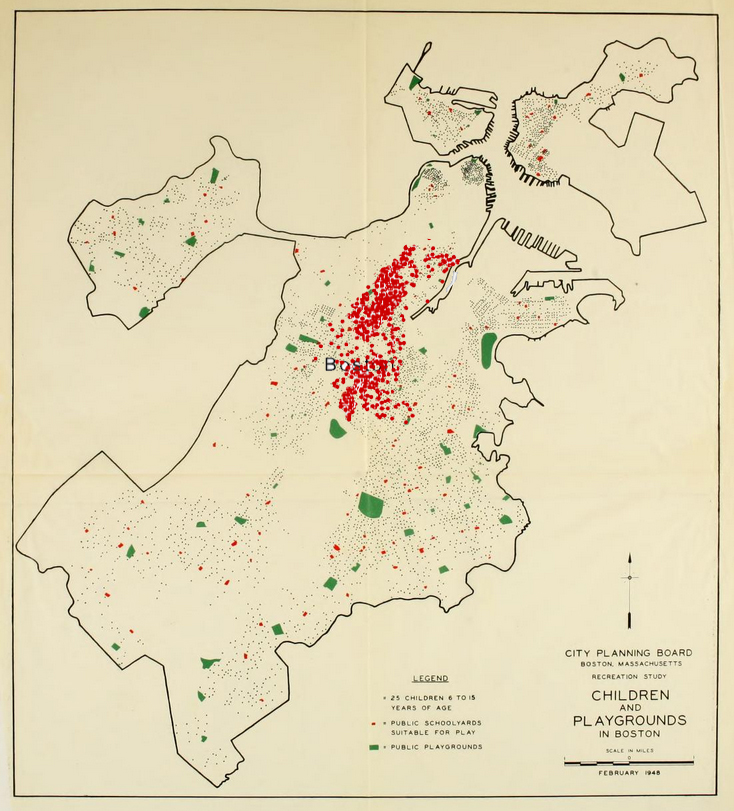
Figure 6 Clustering in figure 4 superimposed on figure 5 to show lack of public playgrounds where there are significant number of African American residents / Aqsa Butt, Social Explorer, City Planning Board
Spatial Context and Neighborhood Identity
In 1876, Olmsted’s integrated system of parks titled, the “Emerald Necklace,” was completed addressing concerns of the growing population. The urban park system laid foundation for integrated systems of open spaces. This 1948 study similarly analyzes the need for playgrounds to have an efficient system.
It was observed through our Spring 2019 Urban Planning field project, Activating Columbia Road: Reframing a Missing Link, that the way Boston neighborhoods are divided, even if park is nearby (in this case the maximum allowable walking distance of 1/4 – 1/2 mile) it is not always considered part of the sub-neighborhoods that residents identify with.12 This could have been true in 1948 and therefore important in investigating if a playground would have truly served children that were within the ¼ mile radius.
Today, the neighborhood of Roxbury is recognized as having sub-neighborhoods of Dudley and Franklin Field North. Though the Franklin Park sits in the neighborhood of Roxbury and theoretically can be ¼-mile away for a resident living in the sub-neighborhood of Dudley, they may not resonate the park as being part of “their neighborhood”. Therefore, a community participatory process as part of the 1948 study could have benefited the evaluation of space and location as it would have provided sense of identity and place associated with playgrounds.
Additionally, mapping traffic as a barrier limited accessibility for children. In this study a playground cannot be located where crossing is required by children seeking to access a playground. (p. 26)13 Areas requiring crossing of street traffic are considered “not served.” For such areas, appropriate street design interventions could have been recommended to provide safety standards, which would have both decreased travel times and allowed more accessibility to playgrounds.

Figure 7 Selected City of Boston Neighborhoods / Aqsa Butt, MassGIS, Boston Planning and Development Agency
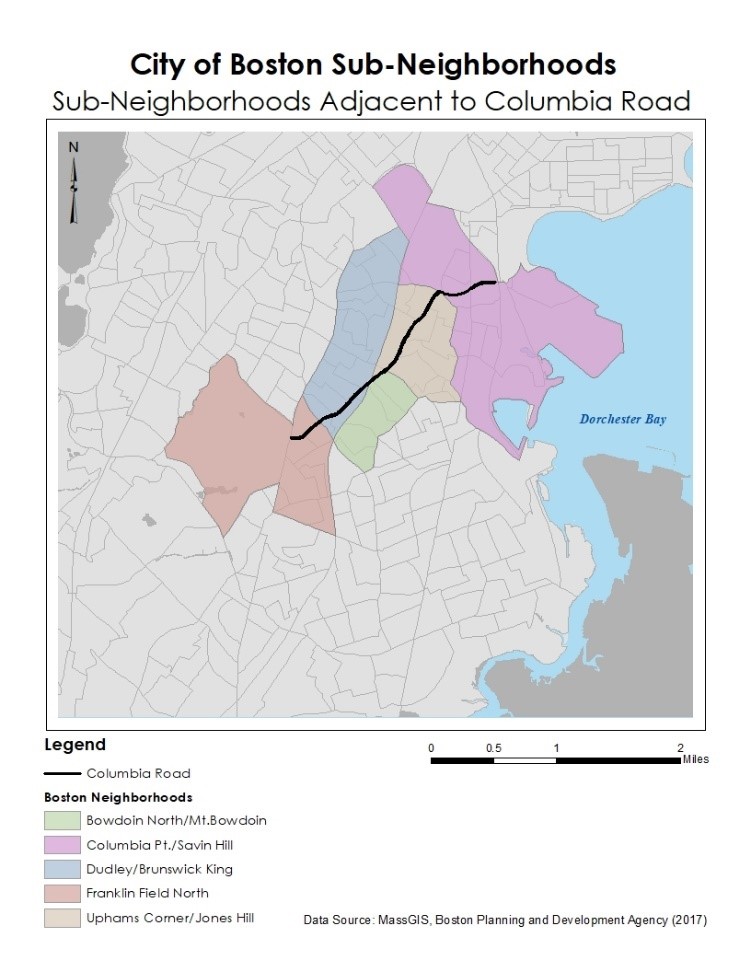
Figure 8 Selected City of Boston Sub-Neighborhoods / Aqsa Butt, MassGIS, Boston Planning and Development Agency 2017

Figure 9 Proposed Parks and Parkways by Olmsted / Norman B. Leventhal Map & Education Center at the Boston Public Library
Environmental and Cultural Context
Other factors missing from the 1948 study include studying location of playgrounds based on land use and destinations. Although the study accounted for playgrounds serving schools, it could have benefited from including other institutions other such as churches, community centers, public libraries etc. Aside from topography, this study also failed to address land use and environmental conditions such as flood prone areas, areas with poor soil conditions etc. that could have also created environmental barriers for new playgrounds.
The Long-Term Consequences of Actions
Today, areas with low income and minority groups continue to lack environmental assets in their neighborhoods. These demographics were not taken account in earlier studies and as a result, communities are still grappling with lack of accessibility today. For e.g. spatially, parks and open space in Boston today are most fragmented and smallest is size where total population of African Americans in 1950 by Census 1950 Tract was the highest.
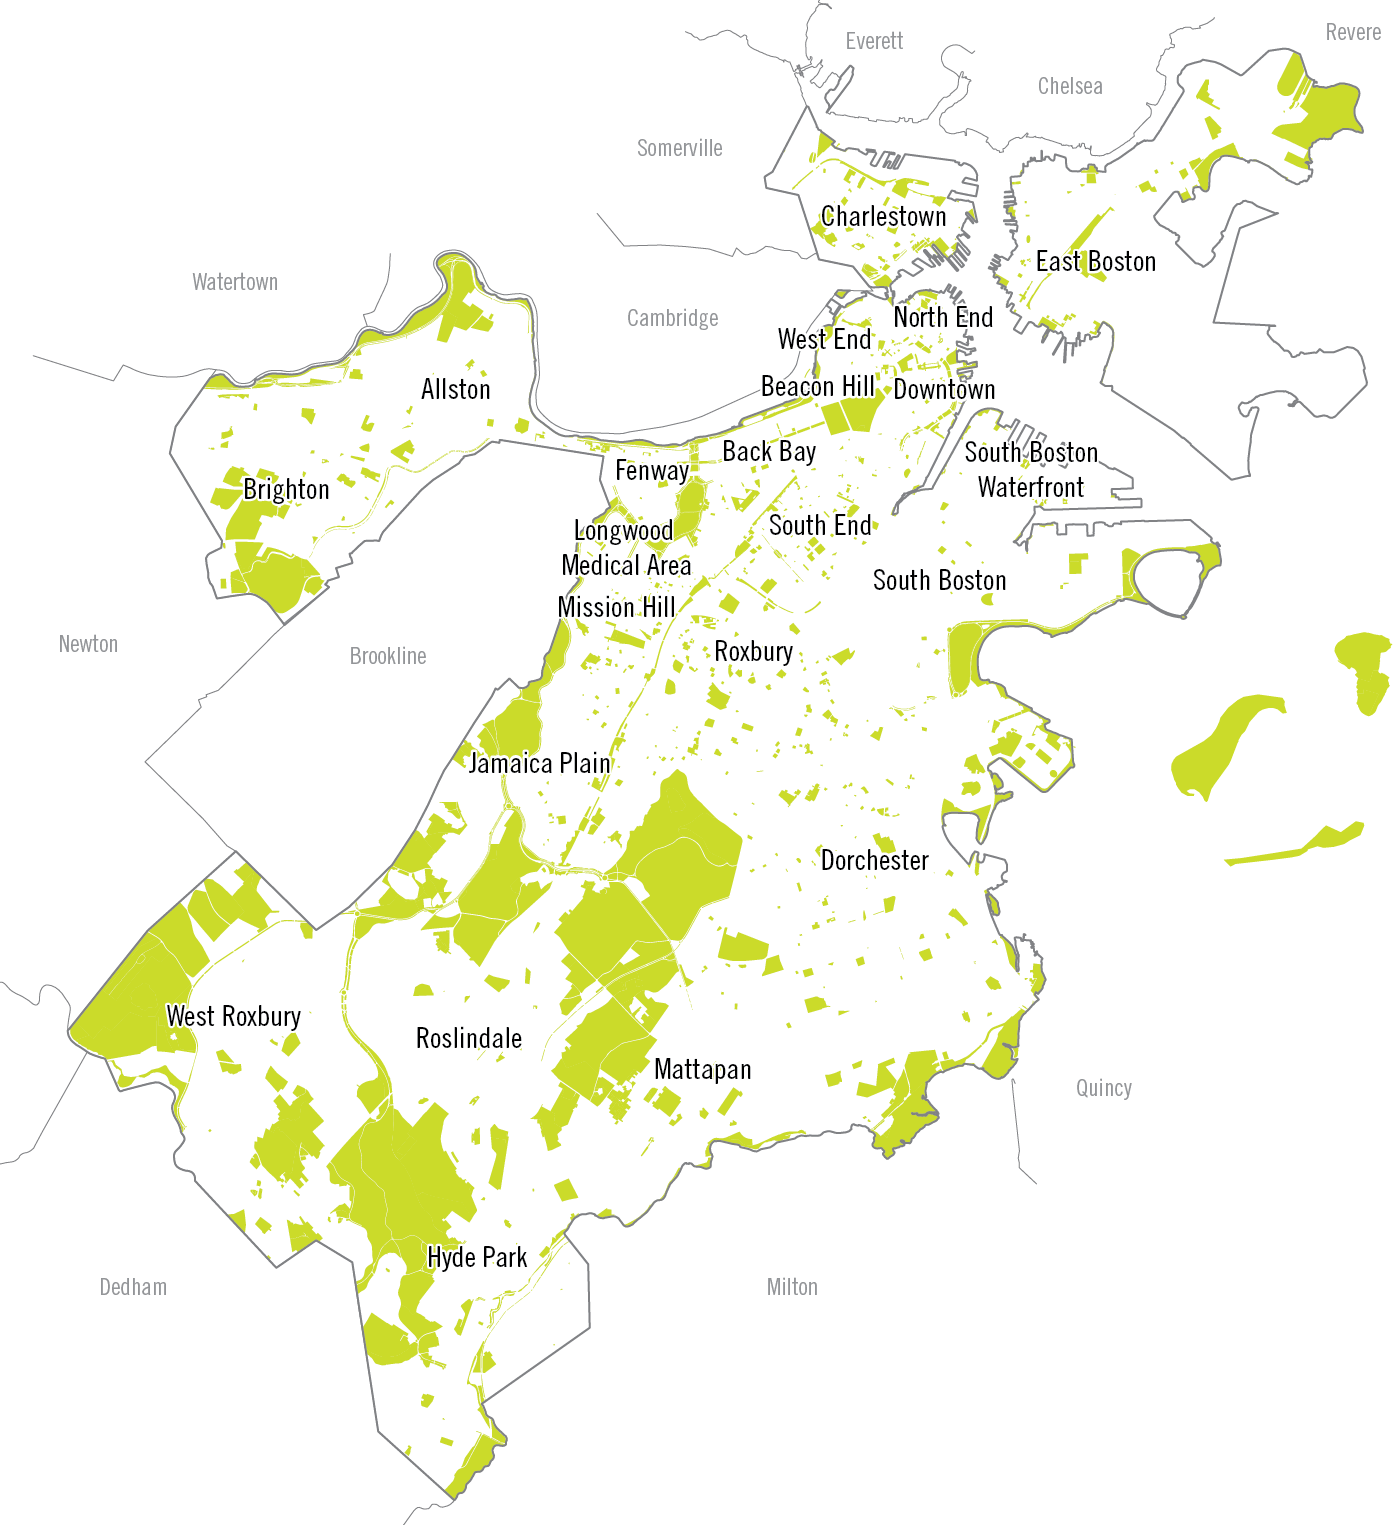
Figure 10 Open Space and Parks in Boston Today / Imagine Boston 2030

Figure 11 Clustering of Total Population of African Americans in 1950 by Census 1950 Tract superimposed on map of Open Space and Parks in Boston Today / Imagine Boston 2030, Aqsa Butt, Social Explorer
On the positive end, this 1948 study sets foundation for standards such minimum allowable walking distance for urban areas and required size of open space per child. Standards such as ¼ mile radius continue to be used as a precedent for accessibility in studies such as our Spring 2019 Urban Field project, Activating Columbia Road: Reframing a Missing Link.
The long-term consequences of not analyzing environmental and land use conditions are obvious. Spatially, locating playground and open space should be based on several factors above accessibility and size to determine longevity, maintenance, and health for future generations to come.
Decisions, Governance, and Participation
In order to provide better service to the public, all open spaces should maximize equity in addition to access. As stated earlier, a community participatory process could have benefited communities of color and lower income population from having weigh in on the strategic locations of planned playgrounds. A community voice is needed to contest for change, which is clearly missing in this 1948 study.
Today, it is recognized that impoverished communities can contain impressive economic resources when given a voice in common interests such as the need for safe and accessible playgrounds. Not having a community process in the 1948 study constrained potential solutions. In this case, a partnership between the community and the municipal government could have provided power dynamics that further mobilized efforts of safety and accessibility as the communities lived in experience contains wealth of knowledge. Plan making today, has shifted in terms of having more than just one actor (the City) and includes more partnerships that collectively bring change to communities.
1 Boston (Mass.). City Planning Board, Childrens’ Playgrounds in Boston: An Evaluation of Space and Location, 1948, http://archive.org/details/childrensplaygro00bost.
2 Boston (Mass.). City Planning Board.
3 Boston (Mass.). City Planning Board.
4 Boston (Mass.). City Planning Board.
5 Boston (Mass.). City Planning Board.
6 Boston (Mass.). City Planning Board.
7 Boston (Mass.). City Planning Board.
8 Boston (Mass.). City Planning Board.
9 Boston (Mass.). City Planning Board.
10 Boston (Mass.). City Planning Board.
11 Boston (Mass.). City Planning Board.
12 “Activating Columbia Road: Reframing a Missing Link,” accessed October 1, 2019, https://as.tufts.edu/uep/sites/all/themes/asbase/assets/documents/fieldProjectReports/2019/activating-columbia-road.pdf.
13 Boston (Mass.). City Planning Board, Childrens’ Playgrounds in Boston.
References:
“Activating Columbia Road: Reframing a Missing Link,” accessed October 1, 2019, https://as.tufts.edu/uep/sites/all/themes/asbase/assets/documents/fieldProjectReports/2019/activating-columbia-road.pdf.
Boston (Mass.). City Planning Board, Childrens’ Playgrounds in Boston: An Evaluation of Space and Location, 1948, http://archive.org/details/childrensplaygro00bost.
“Breathing Room: Mapping Boston’s Green Spaces,” leventhalmap.org, accessed October 6, 2019, https://collections.leventhalmap.org/exhibits/21
“Imagine Boston 2030 Goal 4: Invest in Infrastructure, Open Space, and Culture,” Boston.gov, accessed October 8, 2019, https://www.boston.gov/news/imagine-boston-2030-goal-4-invest-infrastructure-open-space-and-culture.
“Social Explorer,” accessed October 6, 2019, https://www.socialexplorer.com/.
Sources of Graphics:
Figure 1: Norman B. Leventhal Map & Education Center at the Boston Public Library (https://collections.leventhalmap.org/exhibits/21)
Figure 2: City Planning Board (https://archive.org/details/childrensplaygro00bost)
Table 1: City Planning Board (https://archive.org/details/childrensplaygro00bost)
Figure 3: City Planning Board (https://archive.org/details/childrensplaygro00bost)
Figure 4: Aqsa Butt, Social Explorer
Figure 5: City Planning Board (https://archive.org/details/childrensplaygro00bost)
Figure 6: Aqsa Butt, Social Explorer, City Planning Board (https://archive.org/details/childrensplaygro00bost)
Figure 7: Aqsa Butt, MassGIS, Boston Planning and Development Agency
Figure 8: Aqsa Butt, MassGIS, Boston Planning and Development Agency 2017
Figure 9: Norman B. Leventhal Map & Education Center at the Boston Public Library (https://collections.leventhalmap.org/exhibits/21)
Figure 10 and 11: Imagine Boston 2030 (https://www.boston.gov/news/imagine-boston-2030-goal-4-invest-infrastructure-open-space-and-culture), Aqsa Butt, Social Explorer
 Previous Post
 Next Post