Malden River Sub-Watershed Analysis
This post was guided by Water Resources Policy and Planning and Watershed Management, a graduate course at Tufts University. The goal of the analysis was to develop stormwater mitigation strategies to meet Water Quality Standards (WQS) that support swimming in the Malden River.
Introduction: Goal and Overview of the Watershed
Malden River is part of the larger Mystic River Watershed where phosphorus is a major source of pollutant and needs a Total Maximum Daily Load (TMDL) to meet Water Quality Standards.1 Currently, the Malden River is listed as an impaired water according to the Water Quality Integrated Report 305(b)/303(d) (Figure 3).2 According to the Mystic River Watershed Association (MyRWA), a primary contribution of phosphorus pollutants are algae blooms.3 An algae called cyanobacteria can release toxic chemicals that can especially be harmful to humans and pets. 4 Additionally, overgrowth of plants from excess phosphorus contributes to growth of invasive species that make it difficult for swimmers to navigate waters.5
According to 2019 Mystic River Phosphorus Loading Study by MyRWA, the preliminary results of phosphorus loads indicate that reductions of 40-60% stormwater phosphorus load may be needed to attain nutrient related WQS in the Mystic River Watershed.6 MyRWA issues a yearly report card for the Mystic River Watershed along with the Environmental Protection Agency (EPA) where water quality grades are given to sections of the river based on how often they are in compliance with standards for boating and swimming.7 According to the EPA Mystic River Report Card, the section of Malden River in this delineated sub-watershed (Figure 1) has a 60.1% average compliance rate and a C rating.8
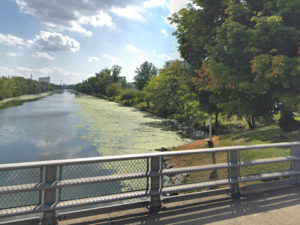
The 431-acre sub-watershed in Figure 4 was delineated using one of MyRWA’s baseline sampling sites. This site is located at Malden River, at Medford St. Bridge (Figure 2 and 4).9 The measured value for Total Phosphorus (TP) sample grab at this site was 0.076 mg/l, according to the most recent data available on National Water Quality Monitoring Council (data collected on June 17th, 2015).10 This is almost 4 times the appropriate limit of TP recommended to avoid causing eutrophication in surface waters (0.02 mg/l value according to EPA).11
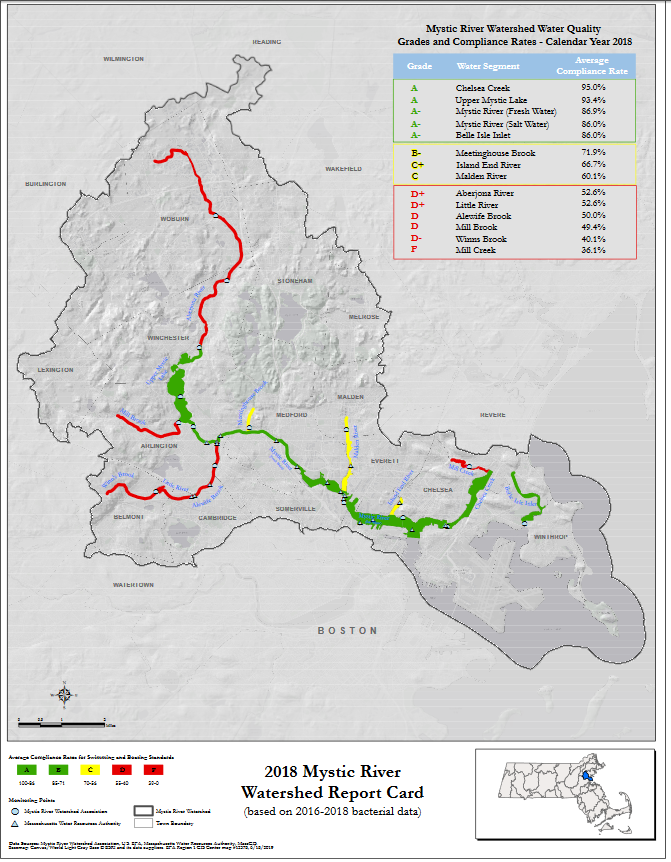
Figure 1 2018 Mystic River Watershed Report Card / mysticriver.org/epa-grade.
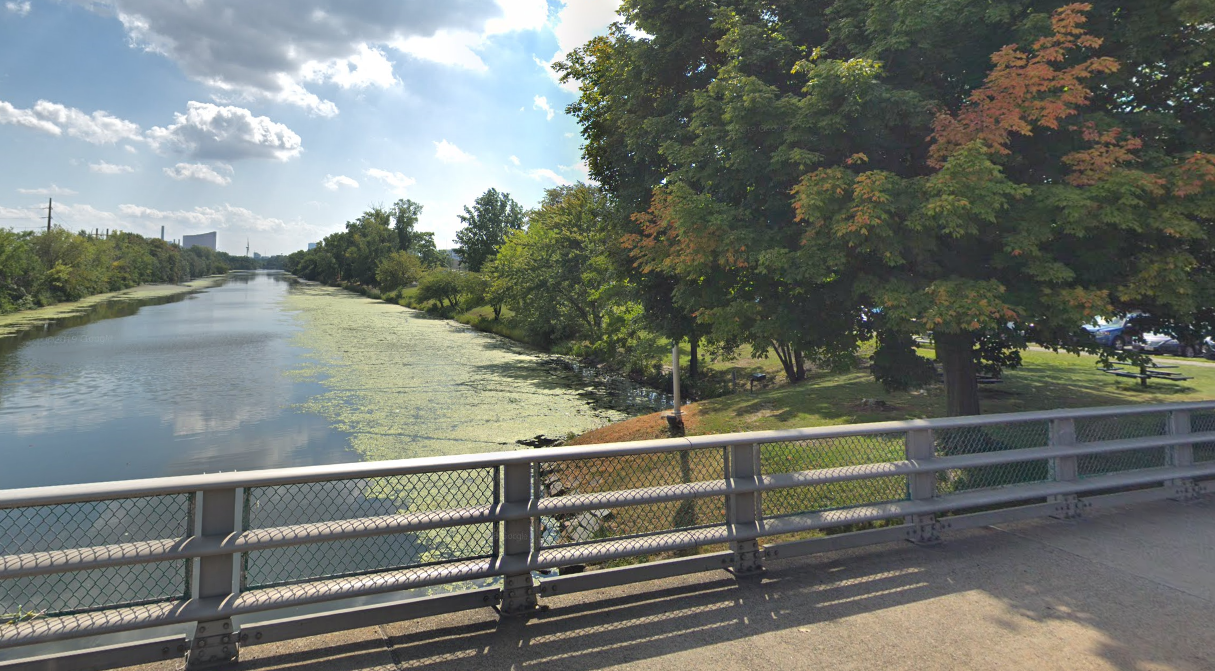
Figure 2 View of the Malden River at Medford Street Bridge / Google Street View
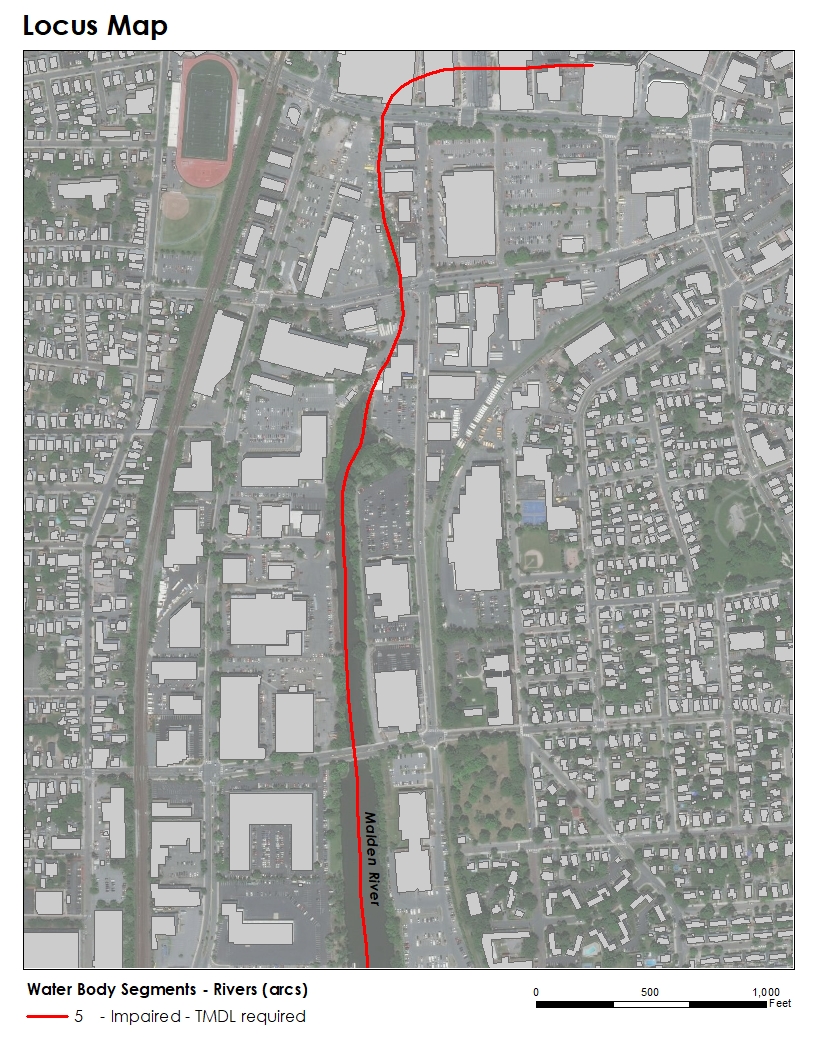
Figure 3 Locus Map / ArcMap with data from MassGIS
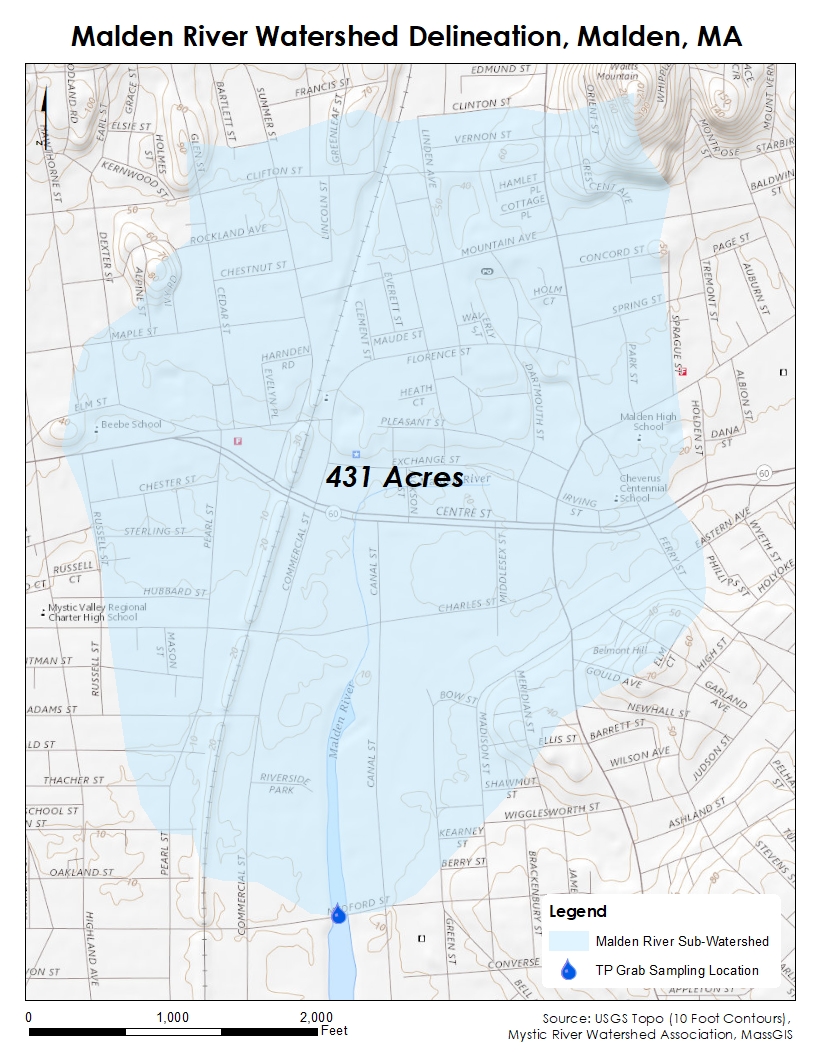
Figure 4 Watershed Delineation / ArcMap with data from MyRWA, USGS Topo, and MassGIS
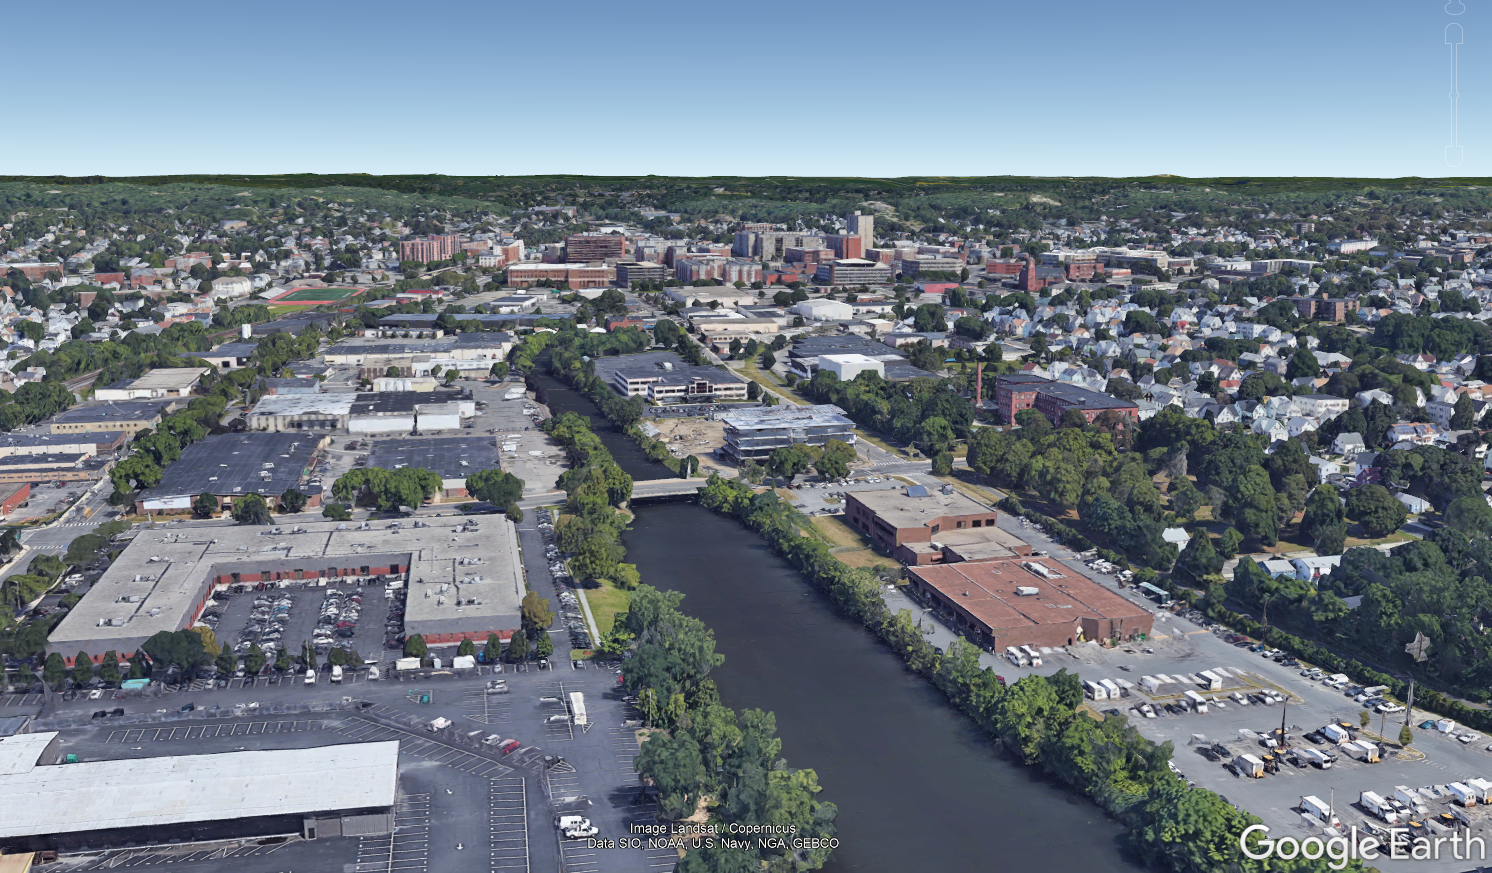
Figure 5 View of urban development and impervious cover surrounding the Malden River / Google Earth
Hydrologic Budget and TMDL Loading for Phosphorus
A hydrologic budget was used to calculate the net inflow at the sampling site. The calculations used the annual precipitation rate in Massachusetts (48 in/year), the annual evapotranspiration rate in Massachusetts (24 in/year), and the runoff and recharge rates from pervious cover (Soil A types) and impervious cover (urban land, wet substratum and rock outcrop-hollis complex). Table 1 shows area and % in acres for pervious and impervious cover in the delineated sub-watershed. The net inflow calculation for the TP sample grab location is 63.08 MCF/yr. (Table 4)
The Total Maximum Daily Load (TMDL) was calculated using the net inflow and the recommended appropriate limit of TP by the Environmental Protection Agency (EPA) to avoid causing eutrophication in surface waters (0.02 mg/l).12 The calculated TMDL for this sub-watershed is 35.72 kilograms of phosphorus per year (Table 5).

Figure 6 Hydrologic Soil Groups in Malden Sub-watershed Delineation / USDA Web Soil Survey
| Map Unit Symbol | Map Unit Name | Rating | Acres in AOI | Percent of AOI |
| 1 | Water | 2.6 | 0.6% | 105E | Rock outcrop-Hollis complex 3 to 35% slopes | 2.6 | 0.6% | 603 | Urban land wet substratum | 290.3 | 67.3% | 626B | Merrimac-Urban land complex 0 to 8% slopes | A | 37.0 | 8.6% | 629C | Canton-Charlton-Urban land complex 3 to 15% slopes | A | 83.8 | 19.4% | 631C | Charlton-Urban land-Hollis complex 3 to 15% slopes rocky | A | 14.9 | 3.5% | Total Area of Interest | 431.1 | 100% |
Table 1 Hydrologic Soil Group – Summary by Map Unit / USDA Web Soil Survey
| Hydrologic Soil Group | Description | Recharge (in/year) | Runoff (in/year)Map Unit Symbol |
| A | Sand and Gravel | 23.5 | 0.5 | Average Annual Precipitation = 48 inches/year | Evapotranspiration = 24 inches/year |
Table 2 Applicable Massachusetts Hydrologic Budget Conditions, using values from Lecture 2 slides
| Recharge (MCF/yr) | Runoff (MCF/yr) | |
| 135.7 Acres A Soils | 11.5758885 | 0.2462955 | 292.9 Acres Impervious Cover | 0 | 51.034896 |
Table 3 Hydrologic Budget Calculations for Surface Recharge and Runoff
| Total Net Inflow | 63.08 MCF/yr |
| Net Direct Precipitation | 0.23 MCF/yr | Runoff | 51.28 MCF/yr | Recharge | 11.57 MCF/yr |
Table 4 Total Net Inflow
Pollutant: Phosphorus
| TMDL (kg P/year) | 35.72 kg P/year |
| Total P Standard | 0.02 mg/l according to table 4-3 (EPA TMDL Protocol for Nutrients) | Total Net Inflow | 1786226683.02 l/year according to hydrologic budget calculations |
Table 5 TMDL Loading for Phosphorus
Land Use Analysis: Sources of Contamination and Impacts
Impervious cover is a major non-point source contribution of large phosphorus load in the delineated sub-watershed. Approximately, 67% if the delineated sub-watershed is categorized as Urban land, wet substratum by the USDA web soil survey (Table 1). Urban land, wet substratum is developed urban land such as buildings, industrial areas, pavement etc. that cover more than 75% of the land surface.13 Stormwater runoff allows pollutants from impervious and pervious surfaces such as dog waste, fertilizers, salt and de-icing materials, trash etc. to be carried into the Malden River.14 Large quantities of phosphorus can be found on impervious surfaces such as parking lots seen in Figure 5.15 Additionally, the use of combined sewer outflow systems degrade water quality, causing raw sewage, runoff, and industrial wastewater to feed directly into the water during high tide.16
According to MyRWA, there no major agriculture areas or wastewater treatment plants in the Mystic River Watershed and residential and urban areas are its primary sources of phosphorus.17 The top five land uses in the delineated sub-watershed comprise primarily of residential and urban areas including commercial (22%), high-density residential (9%), industrial (27%), multi-family residential (32%), and urban public/institutional (10%) (Figure 7 and 8). The total phosphorus load from the top five land uses alone is 139.25 kg P/year, almost 4 times the calculated TMDL (35.72 kg P/year) for this sub-watershed (Table 5 and 6).

Figure 7 Land Uses in the Malden River Sub-watershed / ArcMap with data from MassGIS
| Land Cover | Acres | Phosphorus Contribution Export Rates lbs/acre/year | Phosphorus Atmosphere Deposition lbs/acre/year | lbs/year |
| Commercial | 85.96 | 0.81 | 0.04 | 73 | Industrial | 107.25 | 0.81 | 0.04 | 91 | Urban Public/Institutional | 38.94 | 0.54 | 0.04 | 23 | High Density Residential | 33.94 | 0.68 | 0.04 | 24 | Multi-Family Residential | 125.85 | 0.72 | 0.04 | 96 | Total: 307 lbs P/year or 139.25 kg P/year |
Table 6 Total Phosphorus contribution of top 5 land uses in the watershed, generated using export coefficients (average annual phosphorus loads associated with various land uses) from table 5-3 and source and concentration of nutrients from -table 2-1 (EPA TMDL Protocol for Nutrients).

Top 5 Land Uses / Pie Chart by Aqsa Butt

Phosphorus by Land Use / Pie Chart by Aqsa Butt

1 “Phosphorous Pollution in the Mystic,” Mystic River Watershed Association, accessed November 1, 2019, https://mysticriver.org/pollution/phosphorus.
2 “MassGIS Data: DEP 2002 Integrated List of Waters (305(b)/303(d)),” accessed November 7, 2019, https://docs.digital.mass.gov/dataset/massgis-data-dep-2002-integrated-list-waters-305b303d.
3“Phosphorous Pollution in the Mystic.”
4“Phosphorous Pollution in the Mystic.”
5“Phosphorous Pollution in the Mystic.”
6Patrick Herron, “Mystic River Phosphorus Loading Study,” n.d., 19.
7“Water Quality,” Mystic River Watershed Association, accessed November 1, 2019, https://mysticriver.org/water-quality.
8“Water Quality Grade | EPA,” Mystic River Watershed Association, accessed November 7, 2019, https://mysticriver.org/epa-grade.
9“Mystic Monitoring Network Water Quality Manual,” accessed November 7, 2019, https://static1.squarespace.com/static/563d6078e4b0396c216603c8/t/58505b87b8a79b7128bfdfc1/1481661332133/2014_MyRWA_WQ_Manual.pdf.
10“Water Quality Data,” accessed November 7, 2019, https://www.waterqualitydata.us/portal/#siteid=MYRWA-MAR036&mimeType=csv.
11United States Environmental Protection Agency, “Protocol for Developing Nutrient TMDLs, First Edition,” accessed November 5, 2019, https://nepis.epa.gov
12United States Environmental Protection Agency, “Protocol for Developing Nutrient TMDLs, First Edition,” accessed November 5, 2019, https://nepis.epa.gov
13“Soil Survey of Norfolk and Suffolk Counties, Massachusetts (Peragallo, 1989),” accessed November 7, 2019, http://nesoil.com/norfolk/Uw.htm.
14“Pollution in the Mystic,” Mystic River Watershed Association, accessed November 1, 2019, https://mysticriver.org/pollution.
15“Phosphorous Pollution in the Mystic.”
16 OW US EPA, “Combined Sewer Overflows (CSOs),” Overviews and Factsheets, US EPA, October 13, 2015, https://www.epa.gov/npdes/combined-sewer-overflows-csos.
17“Phosphorous Pollution in the Mystic.”
References:
Bob Gibbs, “H.R.7279 – 115th Congress (2017-2018): Water Infrastructure Improvement Act,” webpage, January 14, 2019, https://www.congress.gov/bill/115th-congress/house-bill/7279.
“Herron – Mystic River Phosphorus Loading Study.Pdf,” accessed November 7, 2019, https://static1.squarespace.com/static/563d6078e4b0396c216603c8/t/5ceed289eb39313243 a31c03/1559155353459/Mystic_Science_Forum_Phosphorus_2019.pdf.
“Introduction to the Clean Water Act | Watershed Academy Web | US EPA,” accessed November 7, 2018, https://cfpub.epa.gov/watertrain/moduleFrame.cfm?parent_object_id=2165.
“MassGIS Data: DEP 2002 Integrated List of Waters (305(b)/303(d)),” accessed November 7, 2019, https://docs.digital.mass.gov/dataset/massgis-data-dep-2002-integrated-list-waters-305b303d.
“MassGIS Data: Land Use (2005),” accessed November 7, 2019, https://docs.digital.mass.gov/dataset/massgis-data-land-use-2005.
“Mystic Monitoring Network Water Quality Manual,” accessed November 7, 2019, https://static1.squarespace.com/static/563d6078e4b0396c216603c8/t/58505b87b8a79b7128 bfdfc1/1481661332133/2014_MyRWA_WQ_Manual.pdf.
OW US EPA, “Combined Sewer Overflows (CSOs),” Overviews and Factsheets, US EPA, October 13, 2015, https://www.epa.gov/npdes/combined-sewer-overflows-csos.
OW US EPA, “Integrating Green Infrastructure into Federal Regulatory Programs,” Collections and Lists, US EPA, October 2, 2015, https://www.epa.gov/green-infrastructure/integrating-green-infrastructure-federal-regulatory-programs.
“Phosphorous Pollution in the Mystic,” Mystic River Watershed Association, accessed November 1, 2019, https://mysticriver.org/pollution/phosphorus.
“Pollution in the Mystic,” Mystic River Watershed Association, accessed November 1, 2019, https://mysticriver.org/pollution.
“Soil Survey of Norfolk and Suffolk Counties, Massachusetts (Peragallo, 1989),” accessed November 7, 2019, http://nesoil.com/norfolk/Uw.htm.
United States Environmental Protection Agency, “Protocol for Developing Nutrient TMDLs, First Edition,” accessed November 5, 2019, https://nepis.epa.gov/Exe/ZyNET.exe/20004PB2.TXT?ZyActionD=ZyDocument&Client=EPA&Index=1995+Thru+1999&Docs=&Query=&Time=&EndTime=&SearchMethod=1&TocRestrict=n&Toc=&TocEntry=&QField=&QFieldYear=&QFieldMonth=&QFieldDay=&IntQFieldOp=0&ExtQFieldOp=0&XmlQuery=&File=D%3A%5Czyfiles%5CIndex%20Data%5C95thru99%5CTxt%5C00000016%5C20004PB2.txt&User=ANONYMOUS&Password=anonymous&SortMethod=h%7C-&MaximumDocuments=1&FuzzyDegree=0&ImageQuality=r75g8/r75g8/x150y150g16/i425&Display=hpfr&DefSeekPage=x&SearchBack=ZyActionL&Back=ZyActionS&BackDesc=Results%20page&MaximumPages=1&ZyEntry=1&SeekPage=x&ZyPURL.
“Water Quality Data,” accessed November 7, 2019, https://www.waterqualitydata.us/portal/#siteid=MYRWA-MAR036&mimeType=csv.
“Water Quality Grade | EPA,” Mystic River Watershed Association, accessed November 7, 2019, https://mysticriver.org/epa-grade.
Web Soil Survey. United States Department of Agriculture National Resources Conservation Service, Accessed November 4th, 2019. https://websoilsurvey.nrcs.usda.gov/app/WebSoilSurvey.aspx
 Previous Post
 Next Post