Site Selection for Phosphorus Reduction: Sub-Watershed Scale in the Malden River
This post was guided by Advanced Geospatial Modeling, a graduate course at Tufts University. This project builds on the Malden River Sub-Watershed Analysis performed for Water Resources Policy and Planning and Watershed Management graduate course at Tufts University. The GIS analysis aims to select sites for implementation of stormwater mitigation strategies to meet Water Quality Standards (WQS) that support swimming in the Malden River.
Introduction: Goal and Overview of the Watershed
Malden River is part of the larger Mystic River Watershed where phosphorus is a major source of pollutant and needs a Total Maximum Daily Load (TMDL) to meet WQS.1 According to the Mystic River Watershed Association (MyRWA), a primary contribution of phosphorus pollutants are algae blooms.2 An algae called cyanobacteria can release toxic chemicals that can especially be harmful to humans and pets.3 Additionally, overgrowth of plants from excess phosphorus contributes to growth of invasive species that make it difficult for swimmers to navigate waters.4
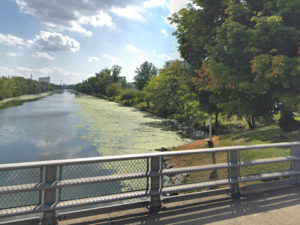
The 431-acre sub-watershed in Figure 1 was delineated using one of MyRWA’s baseline sampling sites. This site is located at Malden River, at Medford St. Bridge (Figure 1). The measured value for Total Phosphorus (TP) sample grab at this site was 0.076 mg/l, according to the most recent data available on National Water Quality Monitoring Council (data collected on June 17th, 2015). This is almost 4 times the appropriate limit of TP recommended to avoid causing eutrophication in surface waters (0.02 mg/l value according to EPA).
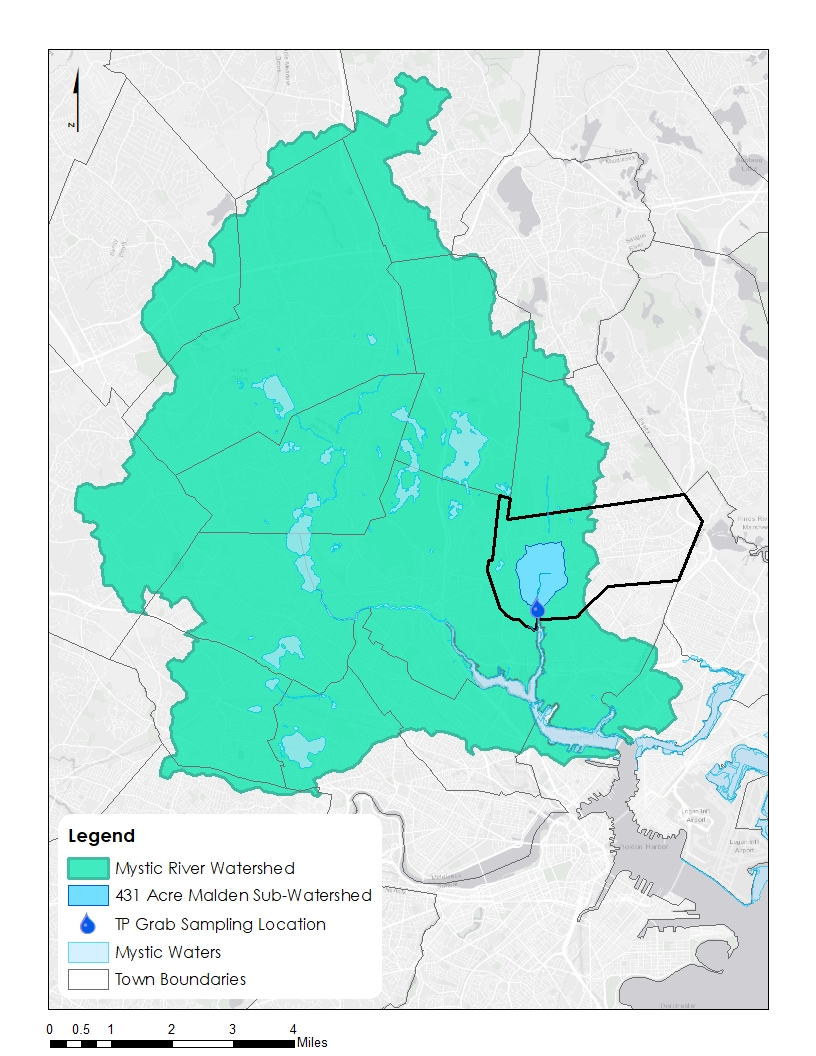
Figure 1: The Larger Mystic River Watershed, 431-Acre Delineated Sub-Watershed in Malden / Map by Aqsa Butt with data from National Water Quality Monitoring Council, MyRWA, and MassGIS
Methodology
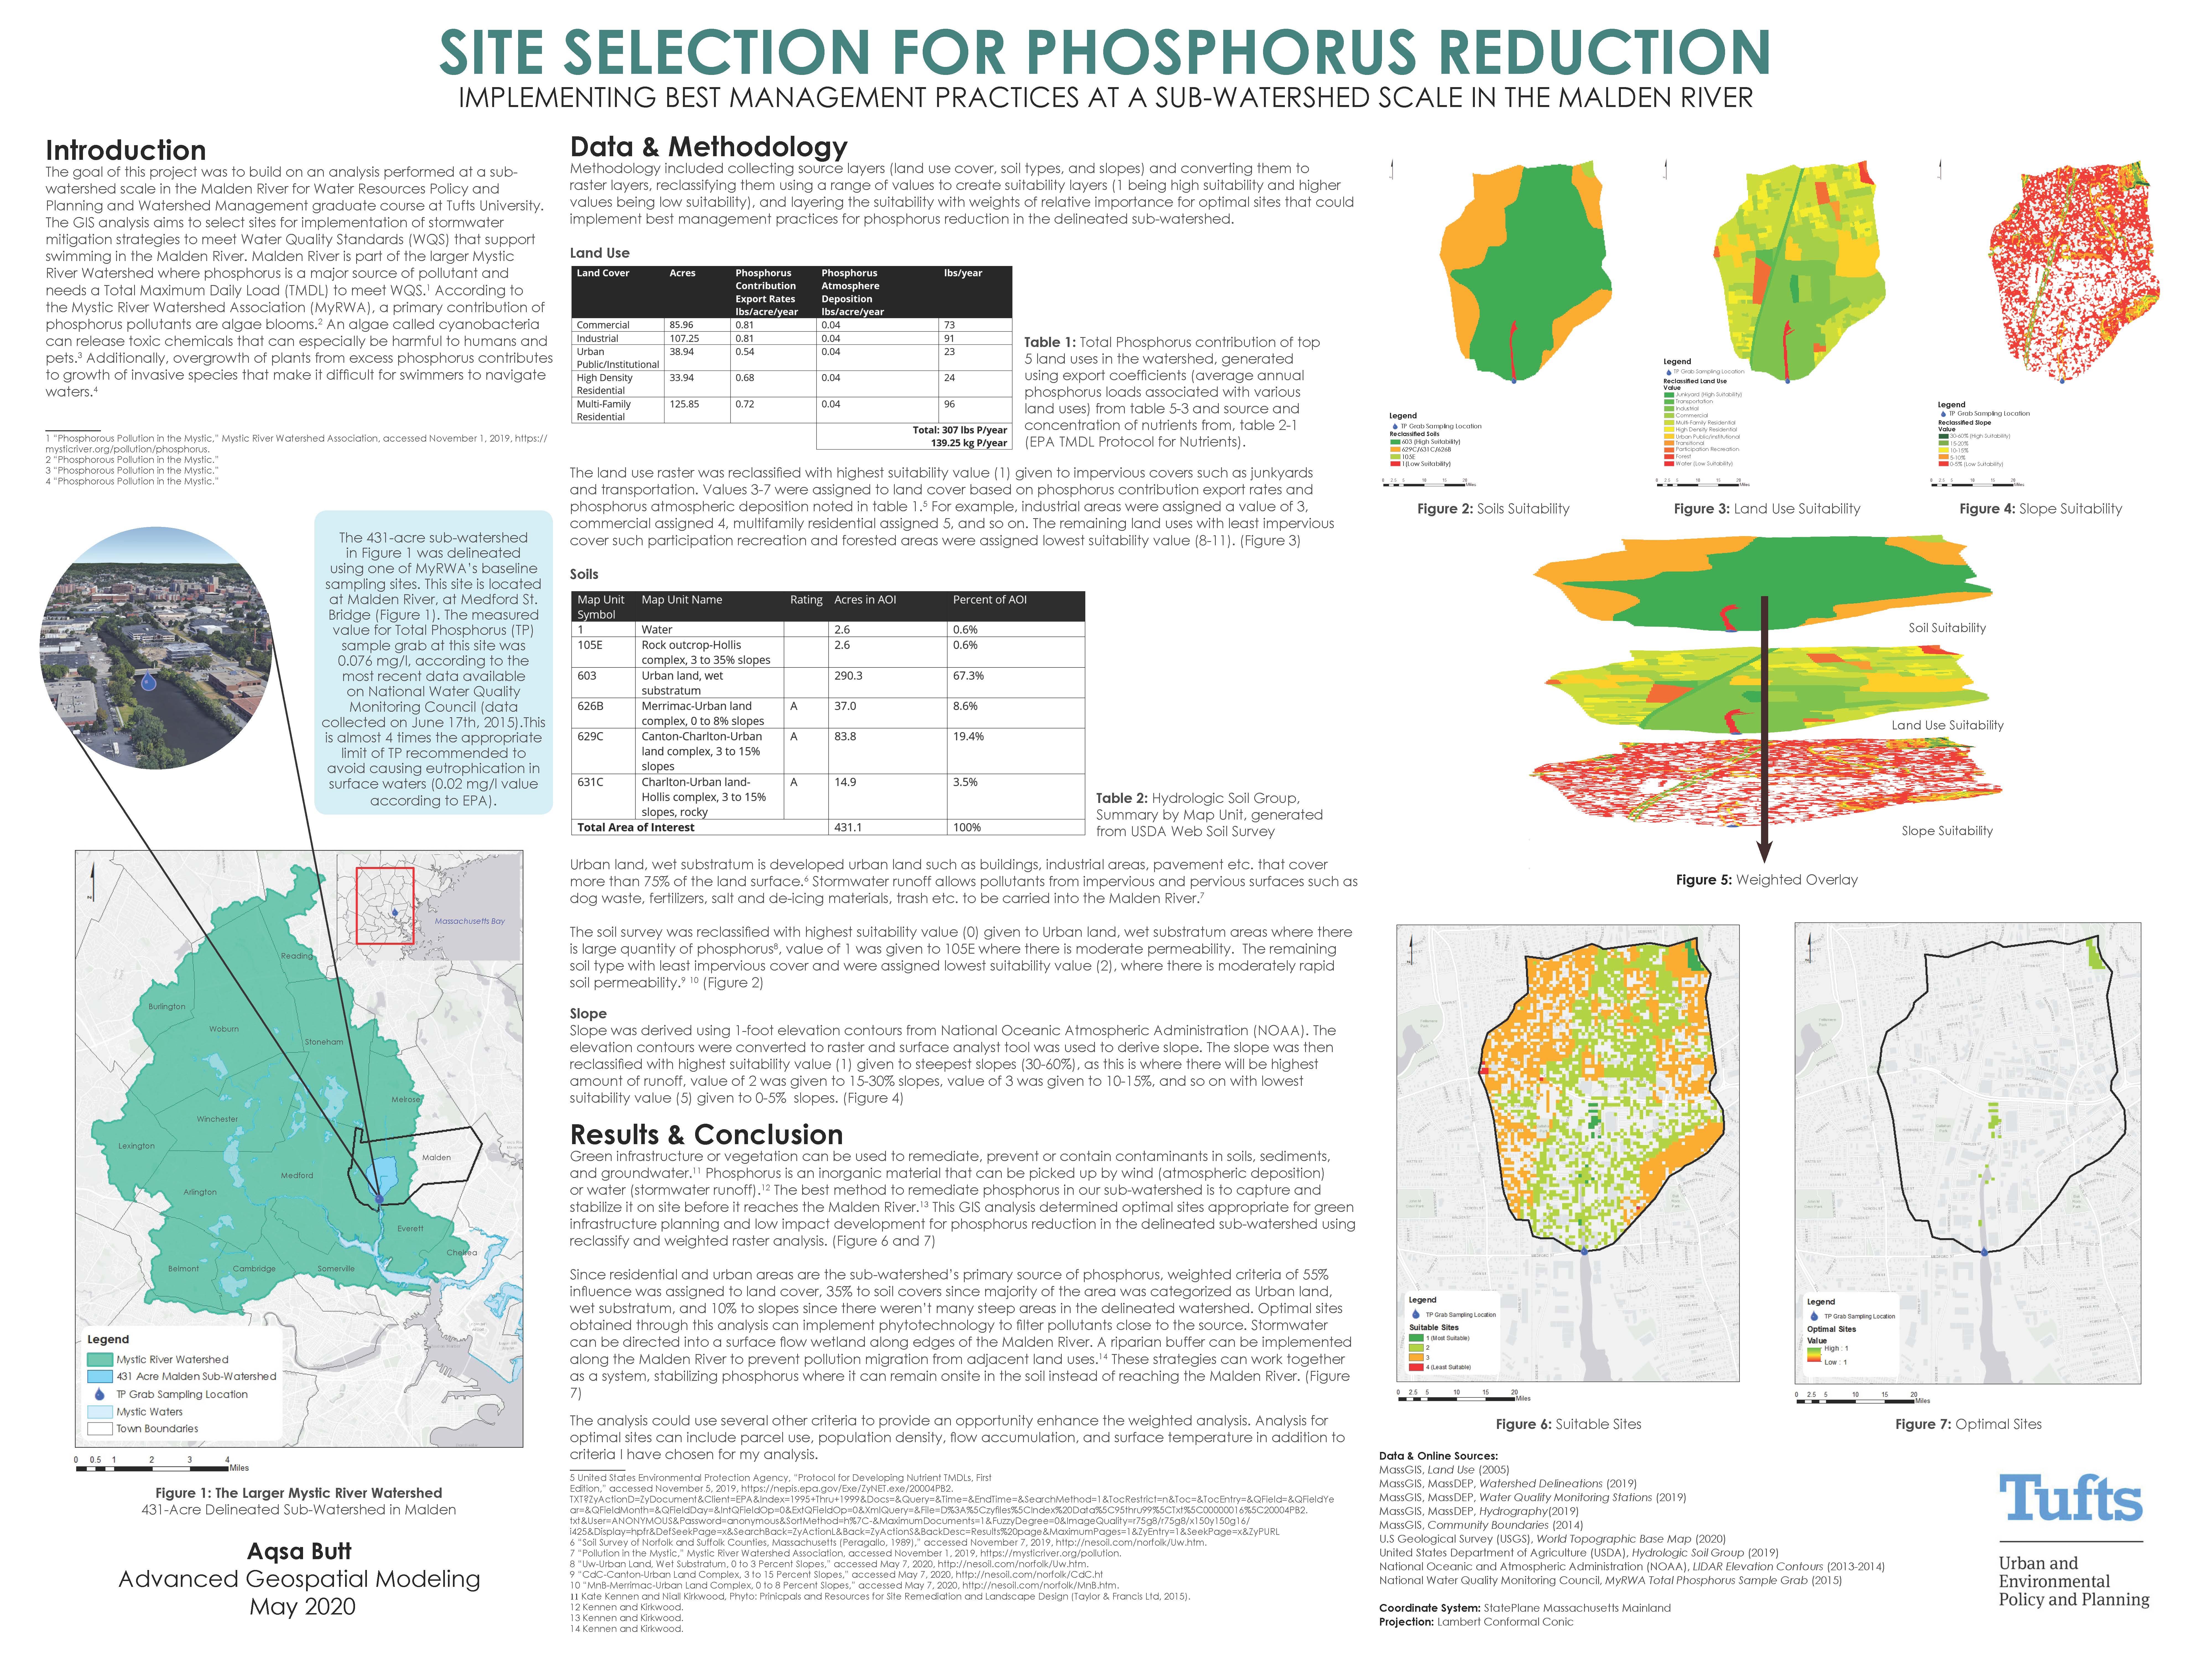
Methodology included collecting source layers (land use cover, soil types, and slopes) and converting them to raster layers, reclassifying them using a range of values to create suitability layers (1 being high suitability and higher values being low suitability), and layering the suitability with weights of relative importance for optimal sites that could implement best management practices for phosphorus reduction in the delineated sub-watershed.
Land Use
The land use raster was reclassified with highest suitability value (1) given to impervious covers such as junkyards and transportation. Values 3-7 were assigned to land cover based on phosphorus contribution export rates and phosphorus atmospheric deposition noted in table 1.5 For example, industrial areas were assigned a value of 3, commercial assigned 4, multifamily residential assigned 5, and so on. The remaining land uses with least impervious cover such participation recreation and forested areas were assigned lowest suitability value (8-11). (Figure 3)
Soils
Urban land, wet substratum is developed urban land such as buildings, industrial areas, pavement etc. that cover more than 75% of the land surface.6 Stormwater runoff allows pollutants from impervious and pervious surfaces such as dog waste, fertilizers, salt and de-icing materials, trash etc. to be carried into the Malden River.7 The soil survey was reclassified with highest suitability value (0) given to Urban land, wet substratum areas where there is large quantity of phosphorus8, value of 1 was given to 105E where there is moderate permeability. The remaining soil type with least impervious cover and were assigned lowest suitability value (2), where there is moderately rapid soil permeability.9 10 (Figure 2)
Slope
Slope was derived using 1-foot elevation contours from National Oceanic Atmospheric Administration (NOAA). The elevation contours were converted to raster and surface analyst tool was used to derive slope. The slope was then reclassified with highest suitability value (1) given to steepest slopes (30-60%), as this is where there will be highest amount of runoff, value of 2 was given to 15-30% slopes, value of 3 was given to 10-15%, and so on with lowest suitability value (5) given to 0-5% slopes. (Figure 4)
Suitability Analysis for Phosphorus Reduction / GIS Poster by Aqsa Butt
Results & Conclusion
Green infrastructure or vegetation can be used to remediate, prevent or contain contaminants in soils, sediments, and groundwater.11 Phosphorus is an inorganic material that can be picked up by wind (atmospheric deposition) or water (stormwater runoff).12 The best method to remediate phosphorus in our sub-watershed is to capture and stabilize it on site before it reaches the Malden River.13 This GIS analysis determined optimal sites appropriate for green infrastructure planning and low impact development for phosphorus reduction in the delineated sub-watershed using reclassify and weighted raster analysis. (Figure 6 and 7) Since residential and urban areas are the sub-watershed’s primary source of phosphorus, weighted criteria of 55% influence was assigned to land cover, 35% to soil covers since majority of the area was categorized as Urban land, wet substratum, and 10% to slopes since there weren’t many steep areas in the delineated watershed. Optimal sites obtained through this analysis can implement phytotechnology to filter pollutants close to the source. Stormwater can be directed into a surface flow wetland along edges of the Malden River. A riparian buffer can be implemented along the Malden River to prevent pollution migration from adjacent land uses.14 These strategies can work together as a system, stabilizing phosphorus where it can remain onsite in the soil instead of reaching the Malden River. (Figure 7)
The analysis could use several other criteria to provide an opportunity enhance the weighted analysis. Analysis for optimal sites can include parcel use, population density, flow accumulation, and surface temperature in addition to criteria I have chosen for my analysis.
1 “Phosphorous Pollution in the Mystic,” Mystic River Watershed Association, accessed November 1, 2019, https://mysticriver.org/pollution/phosphorus.
2 “Phosphorous Pollution in the Mystic.”
3 “Phosphorous Pollution in the Mystic.”
4 “Phosphorous Pollution in the Mystic.”
5 United States Environmental Protection Agency, “Protocol for Developing Nutrient TMDLs, First Edition,” accessed November 5, 2019, https://nepis.epa.gov/Exe/ZyNET.exe/20004PB2.
TXT?ZyActionD=ZyDocument&Client=EPA&Index=1995+Thru+1999&Docs=&Query=&Time=&EndTime=&SearchMethod=1&TocRestrict=n&Toc=&TocEntry=&QField=&QFieldYe
ar=&QFieldMonth=&QFieldDay=&IntQFieldOp=0&ExtQFieldOp=0&XmlQuery=&File=D%3A%5Czyfiles%5CIndex%20Data%5C95thru99%5CTxt%5C00000016%5C20004PB2.
txt&User=ANONYMOUS&Password=anonymous&SortMethod=h%7C-&MaximumDocuments=1&FuzzyDegree=0&ImageQuality=r75g8/r75g8/x150y150g16/i425&Display=hpfr&DefSeekPage=x&SearchBack=ZyActionL&Back=ZyActionS&BackDesc=Results%20page&MaximumPages=1&ZyEntry=1&SeekPage=x&ZyPURL
6 “Soil Survey of Norfolk and Suffolk Counties, Massachusetts (Peragallo, 1989),” accessed November 7, 2019, http://nesoil.com/norfolk/Uw.htm.
7 “Pollution in the Mystic,” Mystic River Watershed Association, accessed November 1, 2019, https://mysticriver.org/pollution.
8 “Uw-Urban Land, Wet Substratum, 0 to 3 Percent Slopes,” accessed May 7, 2020, http://nesoil.com/norfolk/Uw.htm.
9 “CdC-Canton-Urban Land Complex, 3 to 15 Percent Slopes,” accessed May 7, 2020, http://nesoil.com/norfolk/CdC.ht
10 “MnB-Merrimac-Urban Land Complex, 0 to 8 Percent Slopes,” accessed May 7, 2020, http://nesoil.com/norfolk/MnB.htm.
11 Kate Kennen and Niall Kirkwood, Phyto: Prinicpals and Resources for Site Remediation and Landscape Design (Taylor & Francis Ltd, 2015).
12 Kennen and Kirkwood.
13 Kennen and Kirkwood.
14 Kennen and Kirkwood.
References:
“A Gis-Based Green Infrastructure Suitabilty Analysis for Stormwater Management in Gainesville, Florida,” accessed April 10, 2020, https://ufdc.ufl.edu/UFE0049688/00001.
Edward A. Cook, “Green Site Design: Strategies for Storm Water Management,” Journal of Green Building 2, no. 4 (FAL 2007): 46–56, https://doi.org/10.3992/jgb.2.4.46.
“CdC-Canton-Urban Land Complex, 3 to 15 Percent Slopes,” accessed May 7, 2020, http://nesoil.com/norfolk/CdC.htm.
“ChB-Charlton-Hollis-Rock Outcrop Complex, 3 to 8 Percent Slopes,” accessed May 7, 2020, http://nesoil.com/norfolk/ChB.htm.
Kate Kennen and Niall Kirkwood, Phyto: Prinicpals and Resources for Site Remediation and Landscape Design (Taylor & Francis Ltd, 2015).
Krishna P. Dhakal and Lizette R. Chevalier, “Managing Urban Stormwater for Urban Sustainability: Barriers and Policy Solutions for Green Infrastructure Application,” Journal of Environmental Management 203 (December 1, 2017): 171–81,
“MassGIS Data: Land Use (2005),” accessed November 7, 2019, https://docs.digital.mass.gov/dataset/massgis-data-land-use-2005.
“MnB-Merrimac-Urban Land Complex, 0 to 8 Percent Slopes,” accessed May 7, 2020, http://nesoil.com/norfolk/MnB.htm.
“Mystic Monitoring Network Water Quality Manual,” accessed November 7, 2019, https://static1.squarespace.com/static/563d6078e4b0396c216603c8/t/58505b87b8a79b7128 bfdfc1/1481661332133/2014_MyRWA_WQ_Manual.pdf.
“NOAA: Data Access Viewer,” accessed May 6, 2020, https://coast.noaa.gov/dataviewer/#/lidar/search/-7913631.767901828,5222978.609109722,-7905952.292641912,5227830.773173829/details/4914.
“Phosphorous Pollution in the Mystic,” Mystic River Watershed Association, accessed November 1, 2019, https://mysticriver.org/pollution/phosphorus.
“Pollution in the Mystic,” Mystic River Watershed Association, accessed November 1, 2019, https://mysticriver.org/pollution.
“Soil Survey of Norfolk and Suffolk Counties, Massachusetts (Peragallo, 1989),” accessed November 7, 2019, http://nesoil.com/norfolk/Uw.htm.
United States Environmental Protection Agency, “Protocol for Developing Nutrient TMDLs, First Edition,” accessed November 5, 2019, https://nepis.epa.gov/Exe/ZyNET.exe/20004PB2.TXT?ZyActionD=ZyDocument&Client=EPA&Index=1995+Thru+1999&Docs=&Query=&Time=&EndTime=&SearchMethod=1&TocRestrict=n&Toc=&TocEntry=&QField=&QFieldYear=&QFieldMonth=&QFieldDay=&IntQFieldOp=0&ExtQFieldOp=0&XmlQuery=&File=D%3A%5Czyfiles%5CIndex%20Data%5C95thru99%5CTxt%5C00000016%5C20004PB2.txt&User=ANONYMOUS&Password=anonymous&SortMethod=h%7C-&MaximumDocuments=1&FuzzyDegree=0&ImageQuality=r75g8/r75g8/x150y150g16/i425&Display=hpfr&DefSeekPage=x&SearchBack=ZyActionL&Back=ZyActionS&BackDesc=Results%20page&MaximumPages=1&ZyEntry=1&SeekPage=x&ZyPURL
“Uw-Urban Land, Wet Substratum, 0 to 3 Percent Slopes,” accessed May 7, 2020, http://nesoil.com/norfolk/Uw.htm.
“Water Quality Data,” accessed November 7, 2019,https://www.waterqualitydata.us/portal/#siteid=MYRWA-MAR036&mimeType=csv.
Web Soil Survey. United States Department of Agriculture National Resources Conservation Service,
Accessed November 4th, 2019. https://websoilsurvey.nrcs.usda.gov/app/WebSoilSurvey.aspx
 Previous Post
 Next Post